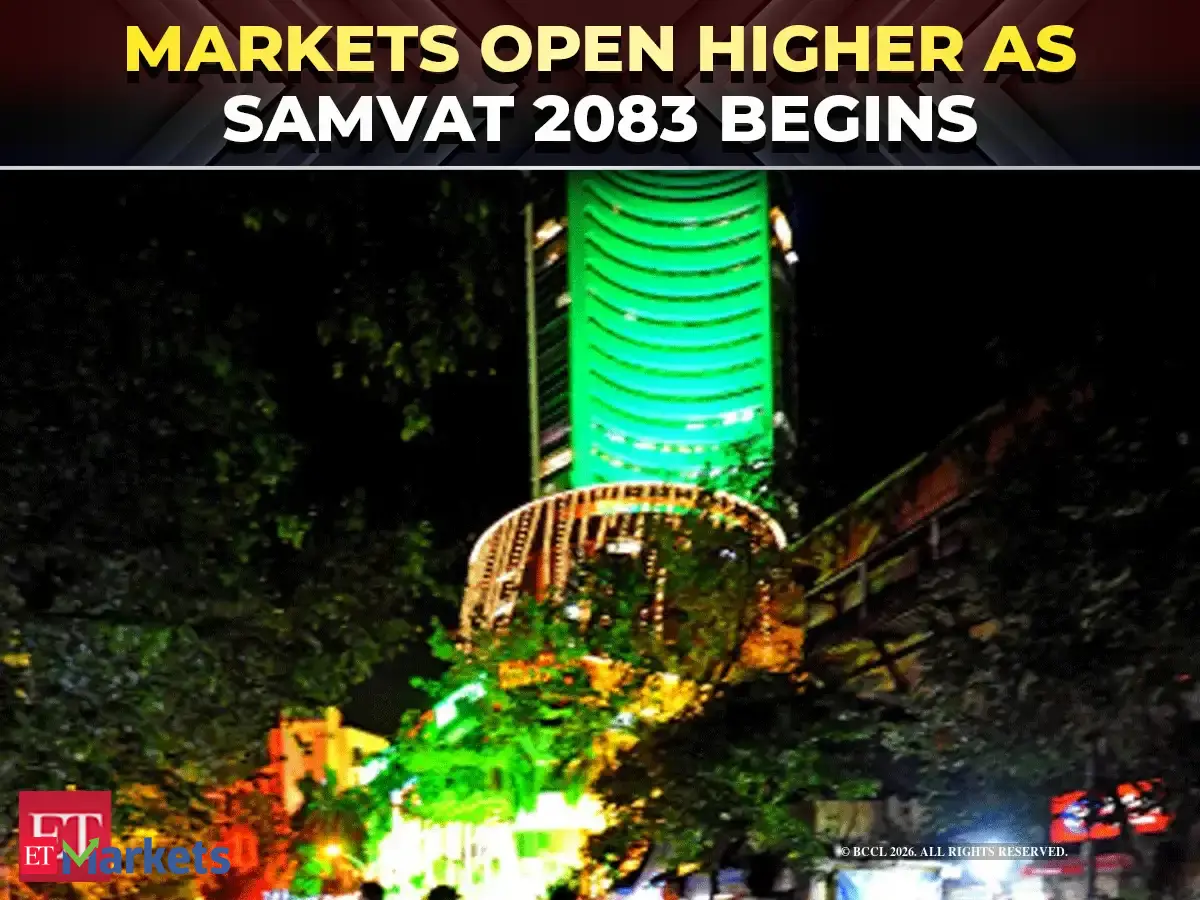
Strong Q2 earnings, healthy October auto sales and firm GST collections set the stage, but Washington supplied the spark.
The US midterm election verdict revived hopes of de-escalation in the Iran conflict and a softer line on tariffs.
The stock has reclaimed all key EMAs, indicating improving bullish momentum and underlying strength.
Its resilient pullback structure further reinforces the positive outlook.
Trading near previous swing highs, the counter appears poised for further upside, supported by a decisive RSI resistance breakout, signalling strengthening momentum.
Osho Krishan, Chief Manager - Technical & Derivative Research, Angel One Agencies 3/6 Buy ITC at Rs 280 | Stop loss: Rs 260 | Target: Rs 300-315 ITC has registered a breakout from its downward-sloping channel over the past week, following a sharp corrective phase, indicating the potential emergence of a trend reversal from oversold levels.
The stock has reclaimed its 20 and 50 DEMA, signalling improving price momentum.
Furthermore, the 14-day RSI has rebounded strongly from oversold territory, historically associated with meaningful recoveries.Osho Krishan, Chief Manager - Technical & Derivative Research, Angel One Getty Images 4/6 Buy SBI at Rs 1,000-1,010 | Stop loss: Rs 940 | Target: Rs 1,080-1,100 SBI has witnessed a notable rebound from its crucial support zone around Rs 940, with the formation of a potential double-bottom pattern at these pivotal levels, indicating the possibility of a trend reversal.
Furthermore, both MACD and RSI exhibit positive momentum, supported by bullish crossovers and sustained strength above key reference levels.
These technical indicators collectively reinforce the improving bullish outlook and suggest the potential for further upside momentum.Osho Krishan, Chief Manager - Technical & Derivative Research, Angel One ETMarkets.com 5/6 Buy M&M at Rs 3,125-3,130 | Stop loss: Rs 3,000 | Target: Rs 3,375 M&M is showing a strong bullish recovery, closing at Rs 3,127.50, up 5.59%, after rebounding from its recent low near Rs 2,750-Rs 2,790.
The stock has formed a strong bullish candle and moved above its short-term moving average, indicating improving momentum and fresh buying interest.
Virat Jagad, Senior Technical Research Analyst, Bonanza Portfolio iStock 6/6 Buy ICICI Bank at Rs 1,500-1,505 | Stop loss: Rs 1,440 | Target: Rs 1,620 ICICI Bank is showing a strong bullish breakout on the weekly chart, with the latest candle gaining 7.30% and closing at Rs 1,500.
The stock has reclaimed its previous resistance zone around Rs 1,480-Rs 1,500, indicating improving buying momentum.
Virat Jagad is Senior Technical Research Analyst at Bonanza Portfolio Disclosure: This Slideshow has been written by Podishetti Akash, who is not a SEBI-registered Research Analyst or an Investment Adviser.
Podishetti Akash and his ‘relative(s)’ (as defined under Section 2(77) of the Companies Act, 2013) do not hold any financial interest in the companies mentioned in this article as of the date of publication.
The views/recommendations mentioned in this article, wherever applicable, are those of the respective SEBI-registered Research Analyst/brokerage and have been reproduced/reported with due attribution.
They should not be construed as the views or recommendations of The Economic Times Digital or the journalist.
Readers are advised to consider the original research report and make their investment decisions based on their own assessment.
Brokerage disclosures here.